What the latest data tells us about public satisfaction with the NHS

Yesterday, the King’s Fund and the Nuffield Trust published analysis of the 2021 British Social Attitudes Survey (BSA) which found that public satisfaction with how the health service runs has fallen to 36 per cent, the lowest since 1997 and a fall of 17 per cent compared to the 2020 survey.
The survey, conducted in September and October 2021, showed the fall in satisfaction was across all ages, income groups, sexes as well as supporters of different political parties.
Support for the principles of the NHS remains strong, with 94 per cent believing the NHS should remain free of charge, 86 per cent saying it should be primarily funded through taxation and 83 per cent agreeing the service should be available to everyone.
But what are the reasons for the fall in public satisfaction? The report notes that “COVID-19 has put health and care services under pressure in ways not experienced in their history. Coping with the pandemic when services were already under strain – struggling with waiting lists and staff vacancies…”
This short article looks at some of those challenging metrics, including those in today’s winter sitrep, how they have progressed this winter and what the situation was prior to COVID-19.
Key points
- The NHS has been under serious pressure and ‘running hot’ for many years, having seen NHS spending increase far below average between 2009 and 2019, contributing to staff vacancies, an ageing estate and a waiting list of over 4.4 million when the pandemic began.
- The pandemic has exacerbated these problems and seen the waiting list rise to over 6 million, the numbers of long waiters rising and A&E waiting times, ambulance handover delays and discharging patients all presenting problems, on top of staffing shortages.
- This winter and the latest performance figures magnify those pressures and show why there needs to be honesty about the challenges the NHS faces in the face of public satisfaction in the service lowering. Yesterday’s survey findings must be a wake-up call to the government to avoid inflating expectations around what the NHS can deliver beyond what its possible for staff to deliver.
Since the creation of the NHS in 1948, its spending has increased by an average of 3.7 per cent per year in real terms, but between 2009/10 to 2014/15 during the coalition government, this was just 1.1 per cent, and just 1.5 per cent during the subsequent Cameron and May governments according to calculations by the Health Foundation REAL Centre.
This decade of underfunding contributed to the NHS entering the pandemic with nearly 100,000 staff vacancies, an ageing estate, a waiting list of over 4.4 million and challenges right across the health and care system. Many of the current challenges are therefore not new, but the immense effort of the service to tackle the pandemic and the ongoing pressures COVID-19 is causing as the service starts to live with COVID-19, albeit with continued uncertainty. There is the need for honesty that despite best efforts, the patient experience for the long waiter or the arrival in accident and emergency (A&E) may not be up to the high standards patients rightly expect, and that the NHS is working to restore services and reduce waits as soon as possible.
Emergency delays and ambulance handover delays
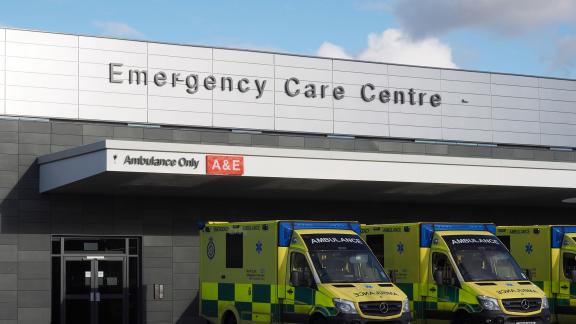
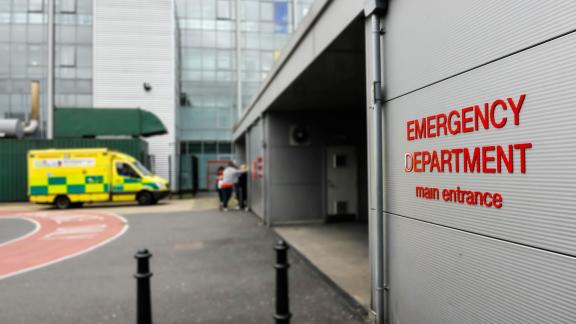
Satisfaction with A&E services fell considerably, from 54 per cent satisfaction to 39 per cent. This is the lowest since the A&E question on the survey was introduced in 1999.
A&E waiting times
One area that has suffered is A&E waiting times.
In 2011, an average month saw 95.1 per cent of attendances to major A&E departments resolved within the four-hour standard for care, with an average of just over 50,000 patients having a total A&E attendance from arrival to admission, transfer or discharge of over four hours.
By 2018, this was averaging over 211,000 people waiting for more than four hours - in March 2018 for example, 271,520 attendances in major A&E departments were over four hours, with 76.1 per cent (865,394) being within the four hour target.
In February 2022, 433,792 total attendances were over four hours, with just 60.8 per cent (640,588) being within the target.
June, July and October 2021 are the three highest months on record for type 1 A&E attendances and February 2022 was less busy than the same month in 2016, 2019 and 2020.
We recognise that COVID-19 challenges and staff absence have had an effect most recently, but the decline in standards over a long time period is clear.
The graph below shows overall attendances to major A&E departments since the start of 2018 and how the numbers of patients waiting over four hours has started to creep upwards:
Ambulance handover delays
Ambulance handover delays have been a problem in the NHS for a number of years, but this issue has caused significant concern across this winter (2021/22) as hospital pressures have risen. Delays over 30 minutes rose over 20,000 in one week for the first time this winter, and they have remained at a high level despite interventions to reduce them.
We covered more on the regional split of ambulance handover delays, what is being done to tackle them and the numbers this winter in a dedicated piece in February.
Waits for elective care
The waiting list rose to over 6.1 million in the latest data available, which runs up to the end of January 2022. When the pandemic began, the waiting list was 4.42 million (as of February 2020), and since September 2020 it has risen every month having previously fluctuated, albeit having been under 3 million as recently as February 2015:
And the number of long waiters has significantly increased. As of the end of January 2022, there were over 311,000 waiting periods of over 52 weeks, compared to 1,643 two years ago. 104-week waiters were not recorded previously, but have been rising month-on-month having been added to the dataset from April 2021:
Discharges
Delayed discharge has been a major area of focus this winter, and despite best efforts from NHS trusts and the wider system, the number of patients who are medically fit to be discharged but remain in hospital is high and has been hard to bring down. The impact on hospitals is felt throughout the system, with a reduced flow of patients through the hospital contributing to reduced efficiency in emergency and elective care
Members have been finding ways to manage this, for example converting wards into specific areas for patients who are medically fit for discharge, using personalised budgets to provide packages of care for patients and to enable family members to take time off to care for them, as well as using more innovative, digital solutions to support patients at home with remote monitoring.
And even with these efforts, the pressures of COVID-19 this winter and difficulties in social care and the community have meant numbers remain stubbornly high. Week ending 27 March, on an average day 12,643 patients remained in hospital who no longer met the criteria to reside, meaning just 41.8 per cent of the 21,720 patients no longer needing to be in hospital could be discharged. This is the worst since January, but the below chart shows that this has been a challenge all winter:
Workforce
We have been calling for a fully funded long-term national plan to address the workforce crisis, with proposals expected before the end of the year.
Yesterday, the NHS staff survey results for 2021 showed that just 27.2 per cent of staff felt there were enough staff at their organisation for them to do their job properly, down from 38.4 per cent in 2020. In ambulance trusts, this fell even more sharply, to 20.3 per cent from 36.7 per cent.
The NHS came into the pandemic with just under 100,000 vacancies, and NHS digital now shows over 110,000 vacancies at latest count, with more than 39,000 of those in nursing (a vacancy rate of 10.3 per cent). Demand modelling by the Health Foundation REAL Centre from September last year, adjusted following the Omicron wave, found that the NHS would need an extra 6,200 consultants and 25,700 nurses on top of those vacancies.
There has been some positive progress on nursing though, with successes in training/hiring new nurses in line with the government’s manifesto commitment of 50,000 new nurses. However, there are still concerns about retention of both current staff and newly qualified staff, GP workforce levels and broader vacancies.
And that’s leaving aside the challenges the service has faced with absence. On an average day, week ending 27 March, 68,885 staff were absent in acute trusts compared to 63,898 in the previous week, and just over 40 per cent of those absences were related to COVID-19, up from 36 per cent in the previous week. The peak this winter reached over 88,000 absences with more than 50 per cent being related to COVID-19.
How is the NHS performing?
View our analysis of the latest NHS performance figures for a rounded view of how healthcare services are coping under immense pressure.


