Building back inclusively: the evidence

*This briefing is based on data produced in August 2021. It accompanies our joint briefing with Boehringer Ingelheim which explores ten radical actions needed to tackle the waiting list inclusively.
Waiting for elective care during the pandemic: what the data tell us
The impact of the pandemic on waiting lists has been widely reported with varying degrees of accuracy. The number of people waiting has grown to record levels, with 5.45 million people already on the waiting list by June 2020, many of whom had already waited for unacceptably long periods.
The referral-to-treatment time (RTT) dataset tells us much more than just the headlines we see reported each month. The data show variation across the country, with marked differences between geographies and specialties. We can also gain some insight into how the pandemic has affected different populations, and what we should do to respond.
The impact of the pandemic on waiting times
It is always essential to have an accurate understanding of the problem before attempting to identify solutions.
Figure A below shows how the different waiting metrics have changed since the pandemic began, compared to a baseline year of 2019.
Figure A. National picture – impact of COVID-19
We see typical seasonal variation in activity with the volume of admitted and non-admitted completed pathways falling during the summer and end-of-year festivities. Crucially, we also see signs of demand outstripping supply, with 4.17 million pathways waiting at the beginning of 2019 rising to 4.42 million at the end of that year.
There were unprecedented changes in waiting time patterns from 2020, directly attributable to the pandemic.
We see how admissions plummeted from normal levels of around 300,000 per month down to a low of 41,000 in April 2020. Completed non-admitted pathways also dropped significantly during the peak of the first wave to below half what we would normally expect. While activity levels improve significantly towards the end of 2020, in no small part due to the heroic efforts by NHS staff throughout the country to adapt to challenging working practices, activity levels remained well below what we would normally expect for the rest of 2020.
Despite the unprecedented disruption in levels of activity, we did not see a proportionate rise in the official number of people waiting during 2020. Across the year, the waiting list increased by just over 100,000 to 4.52 million. The key to understanding this outcome becomes obvious when looking at the number of people joining the queue. The slump in the number of new periods across 2020 effectively balanced out the fall in activity.
We see a new chapter unfold with data covering the first half of 2021. Admitted activity levels have gradually recovered, and although slightly short of 2019’s numbers, we have reached similar levels. Non-admitted pathways, less encumbered to some degree by requirements for social distancing and infection control when a significant proportion of consultations can take place remotely, are even closer to pre-pandemic levels.
We also see new periods return to normal levels, and because the number of new referrals is so significant, that explains the rise in the waiting list of over 1 million pathways since the end of 2020.
In total, since January 2020, we have seen:
- 3,396,139 completed admitted pathways: 1,900,105 fewer than expected (-36%)
- 15,435,612 completed non-admitted pathways: 4,181,914 fewer than expected (-21%)
- 22,988,778 new RTT pathways: 7,420,125 fewer than expected (-24%)
Variation across the country
The box plots in Figure B below show how waiting times vary across the country with each dot representing an individual integrated care system (ICS). A position above the 0 per cent horizontal axis shows an ICS with greater activity than in 2019. Conversely, any respective measure that has stepped back is positioned below the axis.
Figure B. Change by ICS compared to 2019
Strikingly, we see some ICSs with considerably higher levels of activity than in 2019, but the majority with notably lower levels of admissions. We see similar variation across other metrics, i.e. completed non-admitted pathways, new starts and the total waiting list.
Clearly, local levels of COVID-19 are a significant component in local variation, but it is also notable that some ICSs stand out that have both high levels of relative activity, and lower overall waiting lists. More research could be done to examine which approaches work most effectively, and we explore lessons and recommendations about how to reform our approach to waiting later in this paper.
The missing waiting list
As shown above, there is a shortfall of 7.42 million new periods compared to what we would have expected since the beginning of 2020. This one of these is a patient journey by someone, who were it not for the pandemic, would likely have sought care during the past 18 months – the ‘missing’ waiting list. Many of these will be for conditions that deteriorate over time and have a significant day-to-day impact on patients’ ability to go about normal life.
Crucially, it is important to note that even though the waiting list has increased by 1 million this year, that is not because the missing waiting list has begun to return. It is the result of the elective deficit, whereby day-to-day demand is outstripping the service’s ability to provide care.
Add this missing 7.42 million to the currently waiting 5.45 million and we see why one of Sajid Javid’s first statements as Secretary of State was to highlight the potential waiting list challenge that looms before us.
Figure C below shows how the missing waiting list breaks down by specialty.
Figure C. Variation in missing waiters by specialty
We would expect to see high volume procedures dominating the specialties with missing waiters. However, trauma and orthopaedics, ophthalmology and ENT are all overrepresented compared to the average. Across all specialties, there have been 24 per cent fewer new referrals than we would have expected since the beginning of 2020. However, in trauma and orthopaedics we see 35 per cent fewer referrals, ophthalmology is down by 28 per cent and ENT 31 per cent below expected.
Length of time spent waiting
As well as more people waiting, people are waiting longer. Increasingly, the NHS constitutional requirement to ensure treatment begins within 18 weeks for 92 per cent of patients feels like a distant commitment.
Figure D below shows how the number of people waiting for long periods has changed over the course of the pandemic.
Figure D. Number of long waiters
Here we see that the number of people waiting over 18 weeks peaked in July 2020 with over 2.15 million pathways. We see many of those individuals reflected in the later peaks of people waiting over half a year, three-quarters of a year and then the peak of over-52-week waiters in March this year, exceeding 436,000.
Data about the duration spent waiting for those people waiting beyond one year has only been available since April this year so information is limited. Nevertheless, we can already see that 86,000 people have waited beyond 18 months and as things stand over 5700 people have waited beyond two years.
While this graph shows that progress has been made in reducing the number of these very long waiters, the number of people waiting over these key thresholds is likely to remain reasonably stubborn despite best efforts. Without additional capacity, it will be hard to reduce these numbers soon as increasingly greater numbers of patients join the queue, many of whom will have conditions that require urgent attention.
The impact of deprivation
We can examine the relationship between levels of local deprivation and waiting time trends, by considering correlations between changes in waiting time patterns and average deprivation.
Again, we see a mixed picture across the country, but generally where statistically significant relationships exist we see evidence that suggests:
- increases in admissions for specialties such as trauma and orthopaedics and ENT associated with areas of less deprivation
- increases in waiting list numbers associated with areas of greater deprivation, especially in neurology, general surgery, and dermatology
- overall levels of waiting per head of population associated with areas of greater deprivation.
Although these figures relate to geographic correlations rather than individual patients, these are broadly consistent with the inverse care law, i.e. those who most need medical care are least likely to receive it.
Our members report direct experience of this phenomenon, with people from areas of greater deprivation more likely to postpone treatment or not seek it in the first place.
Why are there 7.4 million missing waiters?
There is no single comprehensive analysis of who makes up the missing waiting list and its underlying reasons. We do however have different strands of evidence that together begin to form a picture.
At the beginning of the pandemic, the direction to “stay at home, protect the NHS, save lives” was widely and wholeheartedly adopted by the public. GP appointment levels fell and we know from the GP patient survey that 42 per cent of patients who needed an appointment in the past 12 months avoided making one.
20 per cent avoided making an appointment because they were worried about the burden on the NHS, 17 per cent avoided because of the risk of catching COVID-19, and 11 per cent found making an appointment too difficult.
Figure E below shows how the number of appointments with GPs changed against baseline levels over the course of the pandemic compared to RTT new periods. The graph also includes community mobility data from Google that shows how people are moving around differently due to COVID-19.
Figure E. GP appointments, waiting list new starts and community mobility trends
There is clearly a close relationship between these three trends, with grocery and pharmacy mobility data acting as a leading indicator of GP referrals, suggesting it is reasonable to expect a further immediate increase in presentations at general practice and subsequent referrals. Indeed, GPs are reporting unprecedented pressures both privately to the NHS Confederation and publicly in media reports.
Of course, most GP appointments do not result in a referral on the elective care waiting list; the missing waiting list is also about who is presenting for what conditions, as well as overall appointment volumes.
We also know from reports from our members that once on the waiting list people from more deprived communities are more likely to cancel or postpone their care. We know that the ability of patients from low income households to take time off from work for care is reduced, and that their access to cars as opposed to public transport is reduced. Conversely, those with more resources and from more affluent communities are more able and willing to engage with NHS administrative procedures and ensure they are seen earlier.
What is clear from this analysis is that:
- We have already seen an uneven distribution of referrals onto elective care pathways
- Variation in people joining the waiting list is caused by numerous factors, including local COVID prevalence, and there is evidence that deprivation plays a role
- Without care, conditions will worsen and some patients, for example those on cancer pathways, may die unnecessarily
What to expect
Considerable growth in the number of people waiting
While we do not know what proportion of the missing waiting list will eventually present for treatment, or when that will happen, it is reasonable to assume some will present. We also know that even if none of the missing waiting list returns, the waiting list will still grow significantly if we cannot exceed the level of activity seen so far this year.
The restrictions imposed on communities by COVID-19, the inevitable pausing of elective work during a winter peak and the necessity of responding to local surges in infections, means that for the immediate future, the system will not be able to simply increase capacity to keep the waiting list in check. For the foreseeable future, there is likely to be an ‘elective deficit’, whereby the number of people joining the queue exceeds the number leaving it. In turn, we should expect and plan for the waiting list to grow significantly.
If ICS are successful in prioritising and targeting health inequalities, then waiting lists will grow more rapidly in those areas.
Statistical anomalies that potentially give a misleading picture
Government needs to be honest with the public about waiting list challenges and how best to respond.
As patients return in ever greater numbers, we will see some statistical distortions that risk giving a false impression. For example, if the total number of people waiting grows considerably, then we will see median waiting time fall, and the proportion of people waiting for a long time also falling. However strongly urged to present a positive spin, health service leaders should avoid using these figures to imply that waiting lists no longer present a challenge, while ignoring the problem of the growing number of people waiting. It is right to emphasise what the service is achieving and the effort that is being made, but government should avoid selectively choosing favourable statistics.
Local variations
While hospitalisations for COVID-19 remain relatively low in relation to case numbers compared to earlier waves, we should expect to see providers facing significant pressures over the coming months. Figure F below shows the current rate of hospitalisations as a percentage of each trust’s peak number of hospitalisations since Covid began. This shows the relative pressure each hospital faces from Covid admissions in proportion to the peak they have previously experienced.
Figure F. COVID-19 hospital cases as a percentage of peak COVID-19 occupancy
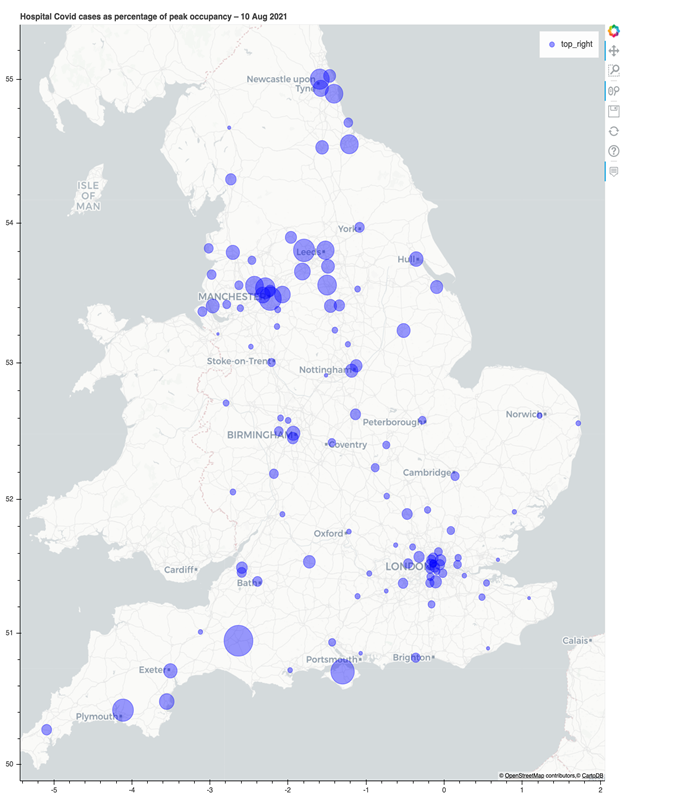
At the time of writing, Yeovil District Hospital NHS Foundation Trust is close to 50 per cent of its peak number of Covid cases, with the Isle of Wight NHS Trust, Manchester University NHS Foundation Trust and Bradford Teaching Hospitals NHS Foundation Trust are not far behind. Two other NHS Confederation members have seen case numbers double in the last fortnight, underlining the ongoing impact of the virus on capacity.
Routine elective work will inevitably be disrupted when COVID-19 admissions reach these levels and trust managers will have to consider whether to restrict or even close sites to cope with surges in COVID-19 demand.
Increasing pressure on primary care
GPs are already reporting extreme pressures coming from a range of directions. These include a surge in appointments, managing COVID-19 programmes, responding to patients with more complex conditions and accumulated exhaustion.
'As waiting times continue to lengthen, patients are having to live with more discomfort for longer, often requiring medication adjustments and ongoing reviews in primary care, which adds to the primary care pressures'
Surges in unplanned activity
As the public becomes increasingly aware of longer waiting times for planned activity, and the consequences of delayed care increase clinical urgency, it is reasonable to expect surges in unplanned activity across the country.
What we don’t know
The analysis above gives some insight into the scale and distribution of the waiting list. Following first outpatient appointments, patients are prioritised based on clinical need. That data is collected centrally, but we cannot accurately describe the national picture or the variation that is likely to exist across the country, as that information is not published as part of the waiting time data set.
A better understanding of people missing from waiting lists could be achieved through improved population health management at PCN level - for example, comparing actual with the expected prevalence (and therefore expected number of patients requiring specific procedures) for that GP registered list.
Similarly, while we can put together individual pieces of the waiting list jigsaw, we only have glimpses of why people are staying away. If we are to plan effectively, we need a better understanding of the people on the missing waiting list, including where they are, what will prompt them to seek care, and when they will likely present.
Taking action
Our joint briefing with Boehringer Ingelheim explores the ten radical actions needed to make progress on the backlog, and to do so in a way that does not exacerbate health inequalities.


