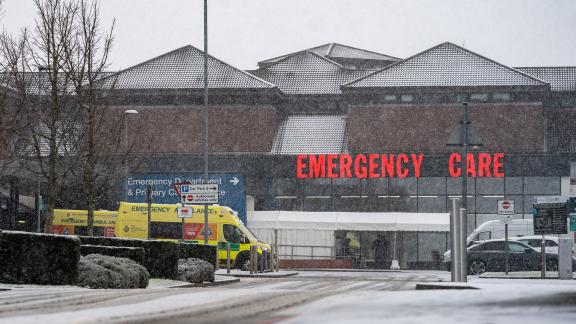
What do the early emergency care sitreps tell us about this winter?

Key points
- While nearly 1,600 more beds are available in general and acute compared to the same time last year, there hasn’t been an improvement in bed occupancy percentages. With flu on the rise, the mood is that beds need to be opened quickly before early to mid-January.
- Although beds occupied by patients with flu have been rising across the first three weeks of winter, up 65.4 per cent from the second week to the third, this is still tracking below last year’s dramatic shift upwards, and services expect a later and longer peak.
- Norovirus also rose by nearly a quarter and some trusts are affected by this disproportionately, with more of their bed base impacted.
- Ambulance handover delays initially looked to have improved in November compared to last winter. However, a 6.9 percentage point rise in handovers delayed over 30 minutes coming into December makes performance look very similar to last year’s challenging winter. This is putting pressure on both the ability of ambulances to respond in the community and acute trusts battling patient flow issues while needing to admit patients into their emergency departments.
- Despite considerable efforts from our members going into winter planning, the situation as we head into the festive period is precarious as viruses rise and challenges in hospital flow come under the microscope. Our members tell us of a real feeling of jeopardy, made worse by imminent industrial action.
Background
NHS England’s urgent and emergency care situation report (sitrep) has been published in various configurations over winter since 2010 and includes a variety of measures such as bed occupancy, beds occupied by flu and norovirus patients and long stay patients. There are also returns for ambulance handover delays, staff absences, 111 and discharge delays. The data is collected routinely, but only published over the winter period.
The first release this winter was on 30 November 2023, and the return continues each Thursday (Friday over Christmas and New Year) and includes data for the previous Monday to Sunday. NHS England describes the data as ‘fit for purpose’, but there is limited validation and sometimes individual providers are missing from the numbers, so some caution should be used with the top level figures. Further caveats around the data are available on the NHS England website.
How does this winter look in comparison and what are our members saying?
This piece aims to set this winter in some context, comparing to previous year’s figures using the first three data points we have. This includes analysis against last winter’s baseline when performance, including patient flow, became a significant issue across the festive period and early January.
Bed capacity and occupancy
With the pressure on patient flow, one of the core concerns once again this winter, the government promised more beds for the winter. But have they been forthcoming and how is any increase affecting capacity?
The initial signs on the overall bed base are positive. On an average day for 4-10 December, 101,260 general and acute beds were available compared to 99,674 (an increase of 1,586, or a 1.6 per cent increase) at the same time last year.
Yet we can’t see a reduction in bed occupancy with patients filling the extra capacity. In general and acute, total bed occupancy for the latest week was 94.7 per cent, compared to 94.5 per cent in the same week of 2022/23.
As a reminder, NHS England’s operational guidance in 2023/24 aimed to reduce adult general and acute bed occupancy to below 92 per cent. An average day across the first three weeks of the sitrep for adult occupancy is 95.5 per cent nationally, with ten trusts reporting occupancy over 99 per cent so far, and a further 16 at 98 per cent above.
There is little flex and bed capacity as a whole will also need to continue to grow to outstrip the peak of last winter across late December and early January, especially with the rise of flu and other viruses expected.
Flu and other viruses
Adding pressure to the bed base are patients with other viruses and the rise of flu. Beds occupied with flu patients did rise 65.4 per cent across the last week’s data, but as shown in the graph below, the current picture is better than last year. Although circumstances and responses are different, data from the Australian winter (June-August 2023) suggests a peak that is not likely to be as sharp as last year, but the peak will be longer and perhaps be a couple of weeks later (mid-January may be the peak rather than around the turn of the year seen last winter).
While it may not be as steep as last year’s rise that contributed to intense pressure on the bed base and flow at the turn of the year in 2022/23, our members are urgently looking to increase bed capacity ahead of mid-January, rushing to open beds that were due later than this. One member said they were trying to do this but in the timescales, staffing them appropriately was difficult.
On norovirus, the picture has also been of rises and is worse than last year, but previous years provide important context. For 4-10 December 2023, 506 adults per day and 5 children were in bed with norovirus. Last year at the same time this was 387 adults and 3 children, 23.7 per cent lower. However, a quick comparison with 2019/20 pre-pandemic shows 854 beds occupied by patients with norovirus, so recent rises may not be unprecedented.
On the other hand, the split of trusts dealing with norovirus could mean serious pressure on their bed bases. For instance, North Cumbria Integrated Care NHS Foundation Trust accounted for over 14 per cent of the adult patients in beds with norovirus in England last week, 12.7 per cent of the trust’s adult bed base. In the previous week, Hull University Teaching Hospitals had 75 adult beds occupied by patients with norovirus, and Stockport NHS Foundation Trust 57, 6.7 per cent and 9.6 per cent of their adult bed base respectively. The national story doesn’t necessarily tell the full picture of individual pressures.
Members have told us of concerns that the potent mix of admissions from viruses on top of flow and capacity pressures could really make this winter even tougher, and there isn’t a lot of resilience in systems generally despite all the planning efforts going into this winter.
Ambulance handover delays
On ambulance handover delays, although the service started out at one in four handovers taking over half an hour, there appeared to be a slight improvement in direct comparison to last winter. Although the specification and definitions for ambulance handovers were updated in October this year to improve the standardisation of approach and factor in handovers both at emergency departments and non-emergency departments, and the introduction of ‘handover time known’ and ‘handover time unknown’, using the former categorisation we can make an attempt to compare proportions of handovers over 30 minutes as shown in the graph below.
The number of handovers delayed over half an hour rose from 26.9 per cent to 33.8 per cent, having been at 33.7 per cent at the same time last winter.
Ambulance handover delays initially had appeared to have improved in November compared to last winter, but this 6.9 percentage point rise in the proportion of handovers delayed over 30 minutes coming into December makes performance look very similar to that challenging winter last year. We have heard from members in the southwest about the pressures on flow and volume of corridor care they are having to provide, correlating with the pressure on ambulance handovers, we have also heard from other members that they are worrying about patient safety and risk as patient flow problems bite at the same time as rising handover delays and the need to bring patients into emergency departments. .
We are likely to see increases to ambulance response times in December if this holds, having seen a slight improvement from October to November with category 2 (major incidents including heart attacks and strikes) responses falling from 41 minutes and 41 seconds to 38 minutes 30 seconds in November. The NHS England target had been to reduce category 2 response times to under 30 minutes across 2023/24 (current average 34 minutes 55 seconds) and we hear that these handover delay pressures at the start of December are likely to increase that average, with ambulances unable to respond to calls in the community as they sit outside full emergency departments.
Discharge and length of stay
In terms of volumes of patients remaining in hospital who no longer meet the criteria to reside, performance has been marginally better than last year (and data in this format is not comparable to previous years). Across the first three weeks of data, on an average day 55.3 per cent of patients who no longer meet the criteria to reside in hospital, still remained in hospital, with regions varying from 42.1 per cent to over 63 per cent.
Length of stay is similar, in that it is a touch better than last year but this has still been rising. As a note of caution, these aren’t necessarily patients ready for discharge and can include those needing long term specialist treatment or very ill patients who need to be in hospital, however it’s a useful proxy measure for patient flow. Looking across the first three weeks of the data compared to the equivalent three weeks last year, the number of patients in hospital for 7 days or more has come down 1.8 per cent, down 3.3 per cent for 14 days or more and down 4.5 per cent for stays of 21 days or more. Yet we are still talking about over 47,000 patients who have been in hospital for over 7 days, more than 27,000 over a fortnight and 18,000 over 21 days.
Absences
One positive is that with fewer COVID-19 absences than the same time last year as well as overall growth in the workforce, more staff are available to combat these winter pressures notwithstanding the impact of industrial action. Staff absences rose in last week’s data to 49,020 per day compared to 47,018 the previous week (there is a small impact within this of trusts not submitting data for the week), but in the same week last year this was 56,567 with nearly 6,200 COVID-19-related absences compared to 1,968 this time around.
But with a later flu season and industrial action 20-23 December 2023 and 3-9 January 2024, as well as the need to quickly open more beds and have the workforce in place for them, staffing remains a worry, particularly for the January week with pent up demand after the Christmas period.
Bottom line
Although the broad picture initially looked slightly better than last winter, testament to our members’ hard work and planning for this winter period, including through opening more beds, there are definite concerns over ambulance handover delays following a sharp rise week-on-week, and the situation is still precarious, far worse than the other winters where we have comparable data, bar last year. Our members tell us of the hazardous position the system is in, with a cocktail of viruses, industrial action and operational flow issues including discharging outside of acutes meaning there is little resilience, and they are worried about the race they have to be ready for their projected periods of peak demand, (including due to rises in flu) in early to mid-January 2024.


