Social care, patient flow and the elective backlog


The elective waiting list in England has risen to 7.1 million pathways. The current picture is complex but as we head into winter, here’s a refresher on how we got here and how issues with patient flow and poor performance in A&E departments, caused in part by the crisis in social care, are constraining efforts to tackle the elective and diagnostic backlog.
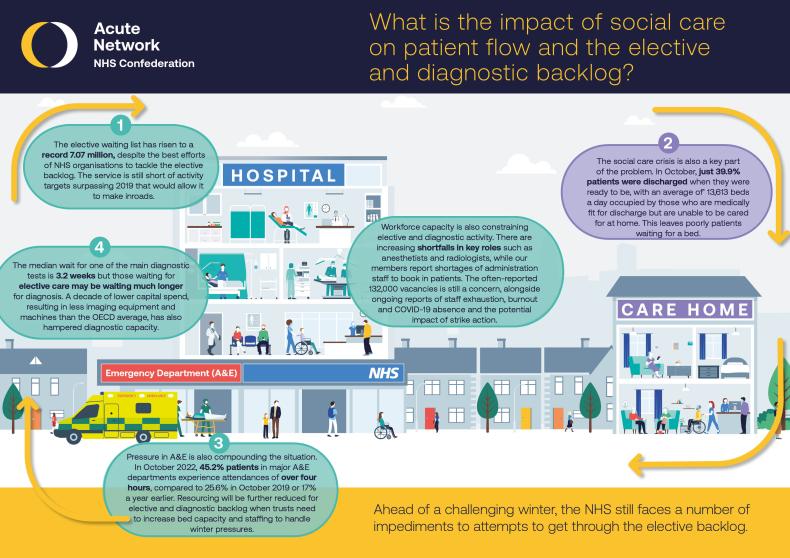
This infographic shows the knock-on effect of limitations in social care on A&E admissions, elective care and diagnostic assessment.
At a glance
In detail
1.
The elective waiting list in England has risen to 7.07 million pathways, with confirmation from NHS England last week that this features approximately 5.5 million unique patients (just shy of 10 per cent of the population).
The waiting list was 4.42 million in February 2020, and below we can see the significant rise after the onset of the pandemic. The sharp rise of the last two years has several reasons, including the crisis in the care sector. You can scroll across the three charts below to see the total waiting list, comparisons of elective activity levels and the volume of joiners to the waiting list compared to pre-pandemic:
Staff across the NHS have made great strides to ramp elective activity back up to close to pre-pandemic levels, but with joiners to the waiting list at comparable levels to 2019 now, it’s no surprise to see the waiting list continue to rise.
2.
So why are we still highlighting issues in social care as a key reason for continued growth in the waiting list? Data for the month of October shows just 39.9 per cent of patients were discharged when they were medically ready to be, with over 13,000 beds on an average day occupied by patients who could have been discharged. Many are waiting for care at home.
And the knock-on effect of the inability to discharge these patients is that beds are occupied by people who don’t need to be in hospital, while poorly patients wait for care. Last month we also highlighted this as a big factor in causing ambulance handover delays.
3.
Performance at the front door of the A&Es continue to get worse, hampered by this inability to discharge patients for care at home. In October, the percentage of patients at major A&Es whose attendances were less than four hours was a record low of 54.8 per cent, while a record 43,792 patients waited more than 12 hours from decision to admit to admission. The two time series charts below show these in more detail.
If staff and bed capacity is needed for emergency care, it can’t be used to tackle the elective and diagnostic backlog. And as the NHS braces for winter, this is expected to get worse.
4.
Another challenge in terms of inroads into the elective backlog is diagnostics. The latest monthly diagnostic data shows 29.8 per cent of patients waiting over six weeks for one of the main 15 diagnostic tests, which is over 463,000 people. On the brink of the pandemic in February 2020, this was just 2.8 per cent. Some patients on the elective list will also be waiting longer for diagnosis as they wait to be seen.
Diagnostic capacity is hampered by years of lower capital spending meaning the UK lags behind other European nations and the OECD average on diagnostic equipment such as MRI and CT scanners.
A question of the workforce
Long-term workforce problems in the service aren’t helping either, with 132,000 staff vacancies, concerns over retention and reports of shortfalls in occupations like anaesthetists and radiologists, alongside exhausted staff after over two years of the pandemic. Those issues are combined with a pension system that is not working, and news this week of forthcoming strike action; a set of issues that will not be fixed overnight and impair the service’s ability to tackle the backlog.
The bottom line
As shown by the cycle of problems in our infographic, one thing the government could do to improve flow and capacity for the service to tackle the elective backlog is to invest in social care wages. Skills for Care note the median pay of £9.50 leaving care workers amongst the worst paid roles in the country, with 165,000 vacant posts and 400,000 leavers in the last 12 months.


