Key points
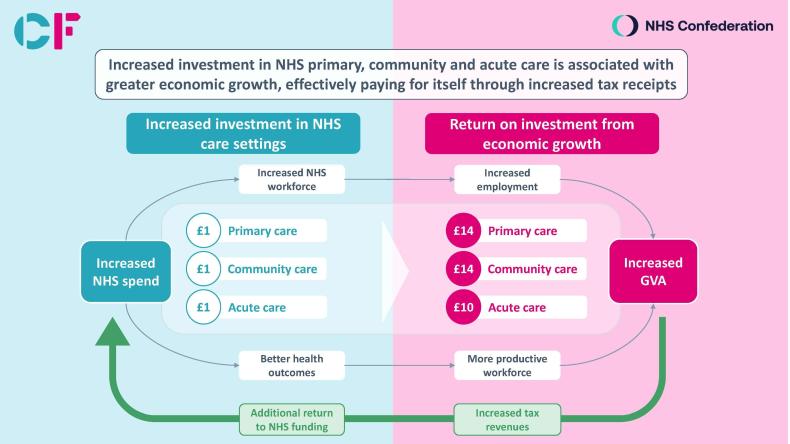
- Economic growth remains a central plank of the government’s reform agenda, featuring as one of the Prime Minister’s top five priorities. In the run up to the 2022 Autumn Statement, the NHS Confederation and Carnall Farrar (CF) modelled the first national attempt at quantifying the positive relationship between increasing NHS spending, health outcomes and economic activity. Our analysis, detailed in From Safety Net to Springboard, revealed that every pound invested in the NHS results in around £4 back to the economy through increased gross value added (GVA). This economic growth includes gains in productivity, as improved health outcomes make individuals more productive within the economy, and increased employment, both directly and indirectly.
- In this follow-up report, we delve deeper into this investment, examining local variations in NHS spend and identifying which of a range of care settings can deliver the most economic output when their funding is increased, including acute, primary, community and mental health care. This differentiation is increasingly important, with the Hewitt review making clear that ‘health value’ is a core part of embedding long-term strategic change and the shift to prevention.
- CF’s analysis, conducted in early 2023, found a statistically significant association between NHS spending increases and GVA growth. While the data does not allow us to definitely conclude healthcare spending is the cause, we are confident in our conclusions. The analysis reveals four headline findings:
- 1) Changes in primary, community and acute spend in England were associated with significant growth in economic GVA between 2015 and 2019. Those areas that increased NHS spend by the most experienced far higher GVA growth than those that increased spend by the least.
- 2) If funding patterns among areas that increased spending the least had matched those that increased spending the most, every additional £1 spent on primary or community care could have increased economic output by £14, were a direct relationship assumed. Higher increases in acute care had lower but still significant impact, with every additional £1 spent potentially increasing GVA by an extra £11.
- 3) Increasing spending in line with those high increase areas could have delivered average benefits of a higher GVA for a typical-sized integrated care system of £1.7 billion from the primary care spend, £1.2 billion from the community care spend and £1.1 billion from the acute care spend. This is a significant economic impact, which some places in England have missed out on.
- 4) On the assumption that the tax burden and distribution of public spending remain similar to today, we estimate that if those areas that increased spending the least had invested an additional £1 billion in community, primary or acute care, the additional economic growth created would have returned more than this amount back into the national NHS budget, thus paying for itself.
- Our hypothesis is that mental health spend will have a similarly high return on investment, but the lack of reliable data hinders our ability to prove this. Absence of evidence is not evidence of absence and improving mental health data should be a nationally prioritised area of urgent focus.
- What is clear is the impressive levels of return on investment that can be derived from investing in this range of services. Indeed, the levels of associated health value are such that we strongly believe the case is proven for further and more focused NHS investment, rather than disinvesting in any one given area.
- Based on our findings, we believe additional investment should primarily be focused on non-acute care to have the greatest impact on GVA. The increased return on investment for these particular settings of care reflects the high level of interactions they have with the local economy: improving population health, supporting people to remain in work, improving local infrastructure and providing good jobs in every part of the country. Both the scale of investment as well as its distribution across care settings matter.
- We make a series of recommendations in this report – for national government, for NHS England and for ICS and NHS leaders. Collectively these recommendations can help equip leaders with the necessary focus, information and evidence base to make challenging decisions about how to allocate their resources, making significant strides in evolving to a more preventative system.

Background
The broad links between the economy and the NHS are longstanding and well understood. In October 2022, the NHS Confederation partnered with Carnall Farrar to quantify the positive relationship between increasing NHS spending, health outcomes and economic activity – the first nationally modelled attempt at such a distinction. The results, published in From Safety Net to Springboard, were stark, with the analysis revealing that every pound invested in the NHS results in around £4 back to the economy through increased gross value added, (GVA), including through gains in productivity and workforce participation.
We believed the analysis would resonate at any moment in time, given the vast national resources necessary to fund the NHS and wider health and care system. However, at a time of increased demand on public services, contrasting with historic low growth and a long period of economic stagnation, it became clear just how vital it was that the NHS could build on its growing ‘anchor’ role in communities and show both decision-makers and taxpayers the wider ongoing value we all receive in economic terms.
While the message that health spending is a positive economic investment is one that remains, and is increasingly being articulated by leaders from across the sector, we have also been clear that to be seen as a continued investment the NHS must act like one. That is why in this report we have dug below the surface of the overall spending on the NHS in England, exploring which settings of care can deliver the most economic output when their funding is increased.
Indeed, it is not just the authors of this report that feel strongly about showing the NHS return on investment. The Rt Hon Patricia Hewitt, former Secretary of State for Health and current integrated care board chair, in her independent review of integrated care systems published in April 2023, saw the shift to creating better ‘health value’ as a core part of embedding long-term strategic change. She stated that this shift is:
‘…entirely in line with cross-government public spending principles, with their strong focus on public value and the outcomes that are being delivered for citizens’ and that ‘the evidence from other healthcare systems as well as our own demonstrates that there is a proven opportunity, whatever the total spend, to create greater health value by investing in primary and secondary prevention and by shifting care from acute to community and primary care settings (allocative efficiency).'
ICB leaders now, as with the leaders of the clinical commissioning groups (CCGs) before them, receive funding from the centre, namely NHS England, but are given a degree of autonomy to allocate the funds across care settings as they see fit. It is this ‘health value’ then that our system leaders are committed to creating as they shape and deliver new integrated care strategies, focused on delivering against their 4 purposes of improving outcomes in population health and healthcare, tackling inequalities in outcomes, experience and access, enhancing productivity and value for money, and helping the NHS to support broader social and economic development.
This report will help national policymakers and ICS leaders collectively start to move the dial on creating better health value
To do this, and to plan and align public service delivery in a complementary way that delivers better outcomes, it is vital we can understand and broadly predict the return on investment in the short, medium and long-term to better direct how we spend our finite resources. In this work we assess the impact of these choices and try to assist leaders in their decision-making going forward.
It should be noted this report is not a one-stop-shop. Many questions remain about the nature of the relationship between the NHS and the economy, including exactly how and where additional investment in the full range of health and care services should go as we seek to move towards a more preventative system; valuing the data, tools and skill set needed to fully embed this journey. We do believe though that this report will help national policymakers and ICS leaders collectively start to move the dial on creating better health value, and to develop a much broader picture of the potential impact they can derive from the many billions of pounds they invest across our communities every year.
Methodology
We worked alongside the health analytics team at Carnall Farrar to understand and assess economic output by individual care setting, 1 seeking to test our hypothesis that higher increases in certain NHS service spend generated higher gross value added (GVA). 2
The methodology involved splitting historical clinical commissioning group (CCG) 3 spending increase figures by highest and lowest across community, primary, acute and mental health settings. The data used in this analysis is for England only.
We examined how changes in spend by sector for historic CCGs are related to growth in GVA, comparing change in GVA between 2015 and 2019 for those areas which, between 2014/15 and 2018/19, increased their spend by the most and those which increased spend by the least for each of our four subject settings of care. Spending by sector was calculated using historic CCG spending data, between 2014/15 and 2018/19, using the latest available data while avoiding the complexities associated with COVID-19-related spend. This data was adjusted for inflation, and hereon is presented in 2022 real terms.
Different areas have different populations with different needs. This can make comparison difficult. To compare diverse areas, we have weighted spend to the appropriate needs-weighted populations calculated by NHS England. As such, spending figures are phrased as ‘spend per needs-weighted head’ 4 . It must be noted that it is possible for spending to be higher or lower than needs due to: a) historical patterns and/or, b) deliberate investment choices.
To compare changes in spend with economic growth, we have used GVA at a CCG level, a measure of the total economic value generated in an area, released by the Office of National Statistics. We have assessed GVA in the second calendar year of each financial year, to allow for a lag in the effect of spend on economic outcomes. We found that areas which increased spend by the most between 2014/15 and 2018/19 for community, primary and acute care experienced statistically significant additional growth in GVA, relative to those which increased spend by the least.
Having established that the growth in GVA per head was higher among areas which increased spend by the most, we wanted to quantify the potential opportunity to boost GVA growth among those which experienced spend by the least, if they had behaved like the high-increase areas. To perform this quantitative analysis, we took the difference in GVA growth per head multiplied by the CCG average population size, as per the below equation.
Potential change in GVA growth from 2015 to 2019 = [ (GVAHigh,19 – GVAHigh,15) – (GVALow,19 – GVALow,15)] x CCG population size 2019
We also quantified the possible additional growth for today’s 42 statutory ICSs based on our findings at CCG level. To derive an estimated calculation of additional growth relevant to ICSs, we used the ICS average population size of 1.3 million as opposed to the CCG average population size of around 0.5 million.
Potential change in GVA growth from 2015 to 2019 = [ (GVAHigh,19 – GVAHigh,15) – (GVALow,19 – GVALow,15)] x ICS population size 2019
Additionally, we quantified the estimated potential benefit to the national economy, had those areas which increased spend by the least been able to invest £1 billion into community, primary or acute care. We calculated this by multiplying the pound-for-pound multipliers, previously calculated, by £1 billion, as an exemplar of the missed growth opportunity.
Chapter footnotes
- 1. For the purposes of this research, we considered acute care, primary care, community care, and mental health care. ↑
- 2. GVA measures the contribution made to an economy by one individual producer, industry, sector or region. At the national level, GVA acts as a measure of total economic output and growth over GDP or gross national product (GNP). From a population health lens, GVA growth can manifest in manifold ways, including through gains in productivity and workforce participation, increased consumer spending, and a lower demand for costly healthcare intervention services. ↑
- 3. The data assessed for the purposes of this study ranges from 2015 – 2019, and is therefore at the CCG, as opposed to ICS, level. ↑
- 4. A metric that measures healthcare spending per person based on their healthcare needs. ↑
Delivering health value: setting by setting
Carnall Farrar’s analysis, conducted in early 2023, reveals four overarching findings:

Changes in primary, community and acute spend in England were associated with significant growth in economic GVA between 2015 and 2019. Those areas that increased NHS spend by the most experienced far higher GVA growth than those that increased spend by the least.

If funding patterns among areas that increased spending the least had matched those that increased spending the most, every additional £1 spent on primary or community care could have increased economic output by £14, were a direct relationship assumed. Higher increases in acute care had lower but still significant impact, with every additional £1 spent potentially increasing GVA by an extra £11.

Increasing spending in line with those high increase areas could have delivered average benefits of a higher GVA for a typical-sized ICS of £1.7 billion from the primary care spend, £1.2 billion from the community care spend and £1.1 billion from the acute care spend. This is a significant economic impact that some places in England have missed out on.

On the assumption that the tax burden and distribution of public spending remain similar to today, we estimate that if those areas which increased spending the least had invested an additional £1 billion in community, primary or acute care, this additional economic growth created would in fact have returned more than this amount back into the national NHS budget, thus paying for itself.
How can increased NHS spending drive economic growth?
While we have not proven a directly causal relationship, we hypothesise that increased health and care spending can drive GVA growth in two ways:
1. Increased spend can help improve health outcomes, making individuals more productive within the economy. For example, a patient able to access community care can remain productive in their job, rather than dropping out of the workforce due to poor health. Given the UK’s struggles with the number of long-term sick, improving productivity through enhancing health outcomes is a clear way of growing the economy.
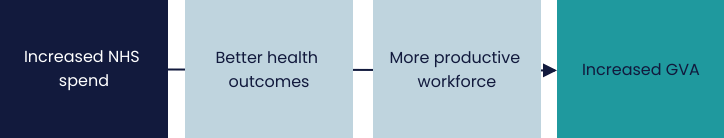
2. Increasing NHS spend helps to grow the economy by increasing employment, both directly and indirectly. The NHS is often the largest local employer, so increasing spend can act as a significant injection into a local economy as NHS organisations with greater funding are able to hire more staff. Furthermore, the NHS is itself reliant on many local companies and organisations. Increased spend in the NHS can therefore help these companies to grow, forming an important part of the local economy.

Proving value in health
From Safety Net to Springboard was necessarily broad, given the lack of a published evidence base and the focus on investment in the NHS budget as a whole. The report did, however, lay the groundwork for successive and more nuanced analysis, particularly in light of the causal link it found between investment in primary care and reductions in A&E attendance and long-term sickness. While our initial report stated the case for putting more money into the NHS, we determined that we must subsequently look at where this additional investment should go.
There are several broad category areas across the totality of health and care spend that deserve attention. The research analysis in this report is not exhaustive and was focused on a selection of these areas where we believed there would be a strong economic case for additional investment, including community, primary, mental and acute care spend. It should be noted ambulance spend is categorised in this as acute care spend. Understanding the return on investment in other areas, particularly social care for example, is vital and while not a feature of this report, should be prioritised in partnership with local government leaders.
In this section, we look at the chosen spend areas for our analysis, the potential return on investment that could be derived by care setting, and whether this would raise enough in additional growth to actually pay for itself, on the assumption that the tax burden and distribution of public spending remain similar to today. As ever, to look forward, we must first look back, with the data used to support the analysis CCG spend in England between 2014 and 2019. It should be noted that the results are not directly comparable to the national findings in the October 2022 report that every £1 invested in the NHS returns £4 in increased GVA. This analysis compares CCG areas that spent the most and the least, with adjustments made for local care needs by setting.
While we were unable to establish causal relationships between spending and GVA due to insufficiently granular spend data, we did find robust statistical associations which are unlikely to be due to chance. We believe this historic CCG data gives real and impactful learning for the 42 statutory integrated care systems currently operating in England.
Community care
Community care is widely considered to be an underinvested yet critical part of the health and care budget. We found that those CCGs which increased community care spend by the most over the five-year period averaged a 32 per cent increase in community spend per head (when needs-weighted) with no change in acute spend.
The analysis has shown that this was associated with an additional average growth in GVA per head of £481 million for the local economy. At the other end of the scale, some CCGs actually decreased community spend by 16 per cent and saw an associated increased spend on acute by an average of 3.6 per cent. If those CCGs had increased spending in line with those with the highest increase, they could have seen this additional £481 million economic benefit for an average investment of only £33 million.
Every additional £1 invested in community care can deliver £14 extra growth for the local economy
We therefore conclude that, if we assume a direct relationship between NHS spend and GVA, every additional £1 invested in community care can deliver £14 extra growth for the local economy, a truly significant return. This corresponds to an additional £1.2 billion growth for an average-sized ICS of 1.3 million population.
Further to this, with tax revenues approximately 40 per cent of the national economy and given that NHS spending is equivalent to around 12 per cent of GDP, we estimate that an investment of £1 billion in community care in those areas that spent the least would have grown the economy to such an extent through increases in, for example, VAT, corporation tax and business rates that it would raise an additional £1.75 billion in NHS spend, thus paying for itself.
Primary care
We began to explore the powerful economic case for investment in primary care in From Safety Net to Springboard, particularly through its workforce. In this report we have built on this and sought to define the additional growth if those CCGs that had increased primary care spending the least over the five years had increased spending in line with those that had increased by the most, in a similar way to above.
The CCGs with the highest increase in primary care spending averaged an 84 per cent increase in spend per head (needs-weighted). This compares to those with the lowest change in investment seeing an increase in primary care spend by an average of 31 per cent. In GVA terms, this difference would bring an additional average growth per head of £676 million, for an investment of only £48 million.
From every £1 spent, a return on investment for primary care spending of £14 in extra growth for the economy
This figure represents a return on investment for primary care spending of £14 in extra growth for the economy from every £1 spent, corresponding to an additional £1.7 billion growth for an average-sized ICS. In relation to the additional taxation revenues raised by growing the economy in this way, we also estimate that an investment of £1 billion in primary care in those areas that spent the least would have raised an additional £1.68 billion for the NHS’s national budget, paying for itself.
Acute care
Acute care has traditionally dominated the health and care budget. Our analysis found that CCGs which increased acute care spending by the most over the five-year period averaged a 9.9 per cent increase in acute spend per needs-weighted head, while those who experienced the lowest change decreased acute spend by almost 4 per cent on average. The additional growth in GVA per head found in the areas with the highest increase was calculated as £446 million, another considerable amount. Those CCGs which decreased acute spend could have unlocked this additional growth for an average investment of £41 million.
A return on investment of almost £11 for every additional £1
This analysis represents a return on investment for acute care spend of almost £11 for every additional £1, corresponding to an additional £1.1 billion growth for an average-sized ICS. Looking at the associated taxation levels, it also estimates that an investment of £1 billion in acute care in those areas that spent the least would have raised an additional £1.28 billion for the NHS, also paying for itself.
Mental health
While mental health is rightly considered an essential component of healthcare, it has historically suffered from underinvestment and has not always been prioritised by researchers and policy and decision-makers. It is our strong hypothesis that there is a clear economic benefit from mental health spend, particularly given the ongoing impact of the pandemic, the cost-of-living crisis and the challenges with the labour market. Unfortunately, while other studies have shown sub-components of this relationship, in this analysis we did not find a statistically significant difference for GVA growth for mental health. This does not mean that higher spending in mental health does not translate into higher GVA, but rather that it was not possible to prove this relationship with the data currently available.
We firmly believe mental health spend will have a similarly high return on investment as for primary and community, and indeed often forms part of these service offerings, but the lack of reliable data, as highlighted by the low score in Data Quality Maturity Index (see below), hinders our ability to determine this. This should be a national area of urgent research and focus – without the collation of routine, robust and high-quality data we simply cannot develop a thorough approach to modelling the associated health value and evidencing the investment decisions system leaders know they need to take.
It is very likely that investment in mental health services will return significant increases in GVA
It should be noted that multiple studies have shown the positive economic outcomes of investing in mental health, including reduced healthcare costs, increased productivity, and improved social functioning, and that there are episodic service examples which help indicate the potential health value that can be derived from mental health spend, such as those for children and young people and with Improving Access to Psychological Therapies (IAPT).
Further to this, the Centre for Mental Health estimates the annual cost of poor mental health to the UK economy to be £119 billion, nearly three-quarters of which is due to the lost productivity of people living with mental health conditions or costs due to unpaid information carers. These are important and go some way to making the case, but we need more and are supportive of other organisations researching this link. Given all this, we believe it is very likely that investment in mental health services will return significant increases in GVA.
Looking across the settings
What is clear from looking across the various settings is the impressive levels of return on investment that can be derived from the full range of services. Indeed, the levels of associated health value are such that our analysis shows the additional taxation raised from a £1 billion investment in these care settings could, for example, raise more than this for the NHS’s national budget, thus paying for itself. We strongly believe therefore that the case is proven for further and focused NHS investment, rather than disinvesting in any one given area.
Focusing on this additional investment matters if we are to create better health value. Based on our findings, we believe future increases in spend should be focused on non-acute care to have the greatest impact on GVA. The increased return on investment for these particular settings of care reflects the high level of interactions they have with the local economy; improving population health, supporting people to remain in work, improving local infrastructure and providing good jobs in every part of the country. Both the scale of investment, as well as its distribution across settings of care, are important. The findings in this report should cause national and system leaders to reflect on the areas they will want to prioritise in developing and delivering strategies, such as for estates or the new NHS Long Term Workforce Plan.
We do, however, recognise the challenges in making difficult decisions and the complexity in attributing certain factors to economic growth. In many ways we are at the start of the journey and the true value from this analysis will be found in collectively focusing minds across the health and care sector, and indeed national government, on what has long been seen as a secondary issue. It should be noted too that in this report we have not considered capital spending, which merits further investigation in its own right, nor have we examined settings of care such as social care or public health, both of which would be vital to consider further.
Recommendations for policymakers
The findings in this report will be of interest for a host of leaders and organisations, both nationally and locally. We have highlighted what we believe are the headline lessons:
National government
- HM Treasury should treat annual government spending on the NHS as an explicit tool of economic development, with the return on investment forming a part of formal decision-making tools, including impact assessments, devolution deals, the Green Book and local strategic economic planning.
- The government should explicitly acknowledge in cross-departmental strategy the vital role services such as community care and primary care play in delivering improved health and economic outcomes. Such an approach to health and care strategy in particular, including in national areas such as workforce and estates, would support system leaders to make challenging long-term investment decisions.
- The Office for National Statistics has a critical role in recording, understanding and measuring population needs more flexibly and in more detail, informing local and national decision-making and better supporting the delivery of holistic public services. Health and care data should be a core part of this overall package and align with economic metrics.
NHS England
- Additional spending on the NHS should be prioritised by NHS England on those non-acute settings, given their larger potential economic impact. This will involve addressing imbalances in existing national health and care strategy, behaviours and understanding.
- NHS England should consider the economic return on investment, or creation of ‘health value’, when developing programmes to support, lead and assess ICS and individual NHS trusts, ensuring it remains a priority.
- Urgent research, priority and investment should be given to the collation of high quality, robust and regular community and mental health data, with which to develop a more detailed understanding of the full return on investment and to shape future policy.
- NHS England should give a much greater degree of flexibility to ICS leaders in how they allocate their resources, to support systems to explicitly create health value, enabling ICSs to focus on where money can be best spent and evolving the necessary shift to developing more preventative models of health and care.
Integrated care systems and the NHS
System leaders are encouraged to use this report to:
- Develop a deeper understanding of the current levels of service spend across their ICS and the potential returns on investment they could derive for the local economy through modelling different approaches.
- Plan towards locally delivering the necessary shift in resources to those services better defined as being preventative, as stated in the Hewitt review.
- Co-develop an agreed narrative across the range of local institutional leaders and partners in the integrated care partnership for the creation of greater system health value, seeking broad collective support for and alignment behind its aims.
- Help define and co-develop local priorities and the metrics for measuring these, as outlined in the Hewitt review.
- Complement emerging system anchor strategies with a more granular understanding of the economic returns generated for the local economy, particularly when seeking to influence local growth planning.
- Work together to demonstrate a compelling evidence base for the impact a greater focus on allocative efficiency can have on communities, ensuring it remains a national priority.
Viewpoint
How much do we know about our potential impact? Spending on health and care is predicted to account for around 44 per cent of budgeted departmental spending by the end of this parliament. There are clear and valid reasons for this and indeed further investment in our sector is vital, urgently needed and, as shown previously, can provide a shot in the arm for the economy. But as this report shows, there is substantial variation in how the current budget is spent across the various settings of care. This matters for several reasons.
Firstly, and as custodians of the taxpayer’s pounds, we have a moral and ethical duty to spend our funding in the most efficient and effective ways possible. There are no sound reasons why broader economic outcomes should not be considered when defining what is efficient and effective spend for our sector and thus when allocating resource. Indeed, not doing so dilutes our ability to fully take economic efficiency into account in future spending rounds nationally and dissuades partners from investing alongside the NHS locally.
Secondly, and as health and care leaders, we are largely united in our belief that we need to move the model of care towards a more preventative approach, aligned with other local public services and more responsive to community needs. This is not going to happen overnight, but neither is it going to happen without growing challenge and support from within the sector. The modelling in this report provides some of that challenge. It should be studied by leaders seeking to ascertain where they currently allocate their resources and, critically, to understand what they can achieve were a different approach taken.
There are very few sectors that can make such a strong, coherent economic argument for investment
Thirdly, the data gives us a general level of understanding of this variation but also highlights a traditional ignorance over how much we ourselves value this perceived value. For both community and mental health care, we urgently require more consistent and better quality data. These care settings can be the key to greater economic and social gains, yet the extent to which we record and study the data is sub-optimal, meaning we often know the least about areas that may matter the most. This inverse correlation reflects decades of an inward-facing form of NHS exceptionalism and needs challenging both nationally and locally.
Fourthly, the understanding of the impact the NHS as an anchor can have in local communities is growing and many trusts, and increasingly systems, have explicit anchor strategies in place. The economic return on investment referenced in this report is an important part of this conversation, ensuring we can evidence our impact and relate to local economic conversations. More than this though, knowing that our investments can unlock such significant GVA acts as a challenge to ourselves to reflect on whether we really are maximising our anchor role.
Finally, there are very few sectors that can make such a strong, coherent economic argument for investment. It is thus odd not to refer to, and evidence, the ‘health value’ we are continuously creating through our decisions; and showing to politicians, partners and populations our broad and sustained impact.
Supporting members to truly shift on prevention
This report is not a one-off, nor is it the end of the story. From Safety Net to Springboard was in many ways the start of unearthing the power of health as an investible proposition. This report continues this work and shows the value of undertaking this form of analysis on a more sustained and detailed basis, providing a broad steer on how to create better health value from within our own budgets. The NHS Confederation and Carnall Farrar are working closely to help leaders understand, narrate and evidence their approaches to system change and will be building up a suite of products in the coming months that will collectively help shift the dial. We look forward to supporting members to truly shift on prevention.
Further information
Our Health Economic Partnerships work programme supports the NHS to understand its growing role in the local economy and to develop anchor strategies at institutional, place and system level. Visit www.nhsconfed.org/topic/health-economic-partnerships or contact Michael.Wood@nhsconfed.org for more information.


